A guide to using infographics in your printed brochure! « Back to list
Infographics are used in all visual media, whether online, on screen or in print. At DigitalPrinting.co.uk, we see a large number of infographics in the brochures we print for our customers.
Complex made easy
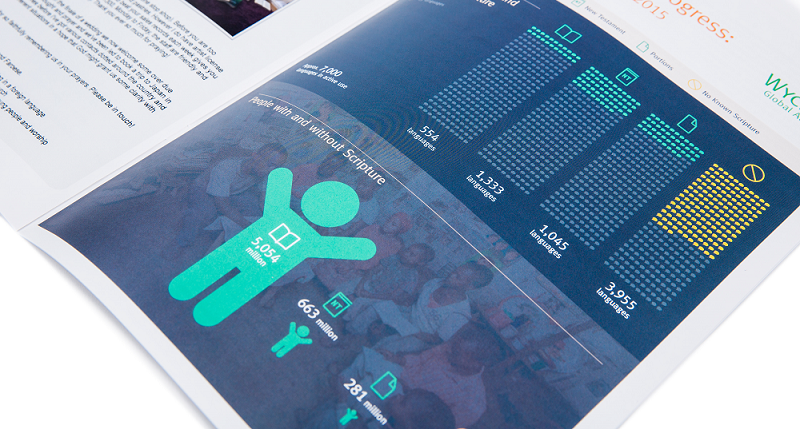
Infographics can be valuable tools for showing complex information more easily. Wikipedia describes an infographic as ”…a graphic visual representations of information, data or knowledge intended to present complex information quickly and clearly. They can improve cognition by utilizing graphics to enhance the human visual system’s ability to see patterns and trends.”
This is worth remembering. It’s easy to get carried away with the design and layout of your infographic, defeating the purpose of its inclusion in your printed brochure. However, if you follow a few basic tips, you can make sure that your infographic will do it’s job perfectly and greatly enhance your publication.
Keep it simple
Remember, the point of an infographic is to simplify complex information so it’s easy to understand quickly. Don’t cram it with unnecessary graphics or text.
Use colour well
You may wish to use colours from your corporate palette, or prefer to have your infographic stand out using different colours completely. Either way, the important thing is that the graphic is clear. Colours can really help show differences or similarities in information. You need to find a balance between the overall design of your printed brochure and how best to present the infographics it contains. Some may even benefit from a single spot colour. It all depends on the facts or figures you need to show.
Avoid data overload
The purpose of your brochure will help determine how much data you need to show. If you’re printing an annual report you may need to show a number of graphics and infographics to illustrate yearly or monthly figures. In other publications, you might simply refer to much of the data in the main content and won’t need to show it all graphically. Even clear, well-designed graphics will lose their impact if overused. Think about the purpose of your printed brochure and its intended readership when deciding how much data you need to show graphically, or how best to portray it.
Think about positioning
If your infographic is connected to text, make this clear from your design and the placement of the graphic. If a diagram is particularly complex or important, it may need its own page or even spread. If it is going across a spread or a fold, consider where the fold or inner spine will fall and keep this area clear of important text. If you are using a full spread, also consider how your brochure will be bound. At DigitalPrinting.co.uk, we print perfect bound, wiro bound and saddle stitched brochures as well as folded leaflets. They all have different advantages and qualities. Check our website for more information on which type of binding will best suit your printed brochure.
Infographics can really enhance the design and content of your printed brochure. DigitalPrinting.co.uk have over 25 years’ experience in the print industry and brochure printing has always been a large part of what we do. To see some great examples or to find out more about effective brochure design, contact our expert team or visit www.DigitalPrinting.co.uk today!


